本ページでは、Python のグラフ描画 (データ可視化) ライブラリである、matplotlib でグラフの線や棒の色に指定可能な色の名前 (カラーコード) とその方法について紹介します。
色の名前で指定
以下のように色の名前を用いて指定できます。指定可能な色の名前は matplotlib.colors.cnames で確認できます。
指定可能な色の名前
>>> import matplotlib
>>> matplotlib.colors.cnames
{'orangered': '#FF4500', 'sienna': '#A0522D', 'mistyrose': '#FFE4E1', ... }
指定可能な色の名前 (一覧)

※ color example code: named_colors.py — Matplotlib 1.5.1 documentation を参考に作成
1 文字で指定
matplotlib の Color API ページによると、以下の主要な色については 1 文字で指定可能です。光の三原色 (RGB) と色の三原色 (CMY) に黒と白 (KW) を合わせた 8 色です。
| b | 青 (Blue) |
|---|---|
| g | 緑 (Green) |
| r | 赤 (Red) |
| c | シアン (Cyan) |
| m | マゼンタ (Magenta) |
| y | 黄 (Yellow) |
| k | 黒 (Black) |
| w | 白 (White) |
出力イメージ

import matplotlib.pyplot as plt
import numpy as np

colorlist = ["r", "g", "b", "c", "m", "y", "k", "w"]
x = np.arange(1, 9)
height = np.repeat(1, 8)
plt.bar(x, height, color=colorlist, tick_label=colorlist, align="center")
16 進数のカラーコードで指定
#ff0000 (赤), #000000 (黒) のような、HTML や CSS で用いられる 16 進数で指定することもできます。
出力イメージ
import matplotlib.pyplot as plt
import numpy as np

fig = plt.figure()
fig.patch.set_facecolor('white')

colorlist = ['#e41a1c', '#377eb8', '#4daf4a', '#984ea3', '#ff7f00', '#ffff33', '#a65628', '#f781bf']
x = np.arange(1, 9)
height = np.arange(1, 9)
plt.barh(x, height, color=colorlist, tick_label=colorlist, align="center")

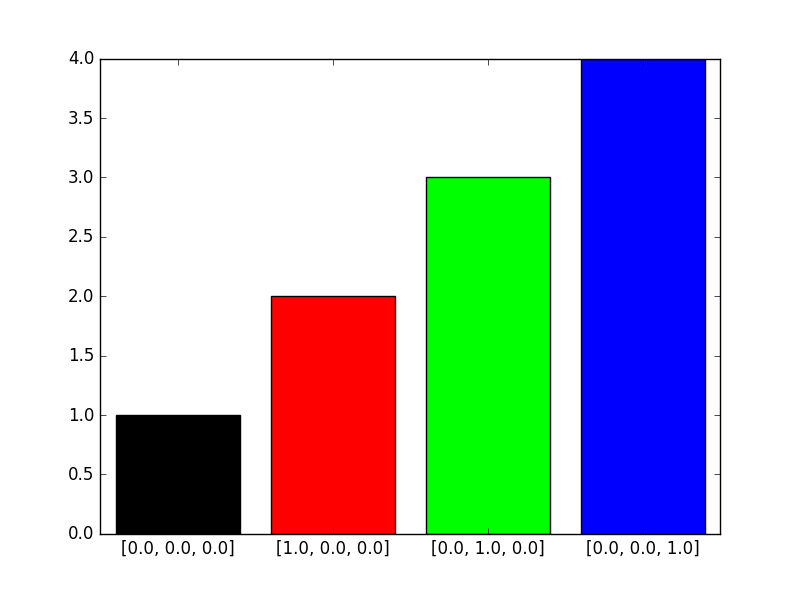
RGB で指定
RGB それぞれのを色の要素を 0.0 ~ 1.0 のタプルで指定することも可能です。
出力イメージ
import matplotlib.pyplot as plt
import numpy as np

fig = plt.figure()
fig.patch.set_facecolor('white')

col1 = [0.0, 0.0, 0.0]
col2 = [1.0, 0.0, 0.0]
col3 = [0.0, 1.0, 0.0]
col4 = [0.0, 0.0, 1.0]
colorlist = [col1, col2, col3, col4]

x = np.arange(1, 5)
height = np.arange(1, 5)
plt.bar(x, height, color=colorlist, tick_label=colorlist, align="center")
グレースケールで指定
‘0.0’ (黒) ~ ‘1.0’ (白) のグレースケールで指定することもできます。作成した資料を白黒印刷する場合に便利です。
出力イメージ
import matplotlib.pyplot as plt

x = [10, 10, 10, 10, 10, 10, 10, 10, 10, 10]
colorlist = ["0.1", "0.2", "0.3", "0.4", "0.5", "0.6", "0.7", "0.8", "0.9", "1.0"]
plt.pie(x, labels=colorlist, counterclock=False, startangle=90, colors=colorlist)
