本ページでは、Python のグラフ作成パッケージ Matplotlib を用いてヒストグラム (Histogram) を描く方法について紹介します。
matplotlib.pyplot.hist の概要
matplotlib には、ヒストグラムを描画するメソッドとして、matplotlib.pyplot.hist が用意されてます。
matplotlib.pyplot.histの使い方
matplotlib.pyplot.hist(x, bins=10, range=None, normed=False, weights=None,
                       cumulative=False, bottom=None, histtype='bar',
                       align='mid', orientation='vertical', rwidth=None,
                       log=False, color=None, label=None, stacked=False,
                       hold=None, data=None, **kwargs)
matplotlib.pyplot.hist の主要な引数
| x (必須) | ヒストグラムを作成するための生データの配列。 |
|---|---|
| bins | ビン (表示する棒) の数。階級数。(デフォルト値: 10) |
| range | ビンの最小値と最大値を指定。(デフォルト値: (x.min(), x.max())) |
| normed | True に設定すると正規化 (合計値が 1 になるように変換) を実施。 (デフォルト値: False) |
| cumulative | True に設定すると、累積ヒストグラムを出力。 (デフォルト値: False) |
| bottom | 各棒の下側の余白を数値または配列で指定。 |
| histtype | ‘bar’ (通常のヒストグラム), ‘barstacked’ (積み上げヒストグラム), ‘step’ (線), ‘stepfilled ‘ (塗りつぶしありの線) から選択。 (デフォルト値: ‘bar’) |
| align | 各棒の中心を X 軸目盛上のどの横位置で出力するか。 ‘left’, ‘mid’, ‘right’ から選択。(デフォルト値: ‘mid’) |
| orientation | 棒の方向。’horizontal’ (水平方向), ‘vertical’ (垂直方向) から選択。(デフォルト値: ‘vertical’) |
| rwidth | 各棒の幅を数値または、配列で指定。 |
| log | True に設定すると、縦軸を対数目盛で表示します。 |
| color | ヒストグラムの色。配列で指定し、データセット単位で色を指定することができます。 |
| label | 凡例を載せる際に使用します。 |
| stacked | True に設定すると積み上げヒストグラムで出力します。False に設定すると、横に並べて出力します。 |
グラフの出力例
import numpy as np
import matplotlib.pyplot as plt

# 平均 50, 標準偏差 10 の正規乱数を1,000件生成
x = np.random.normal(50, 10, 1000)

# ヒストグラムを出力
plt.hist(x)

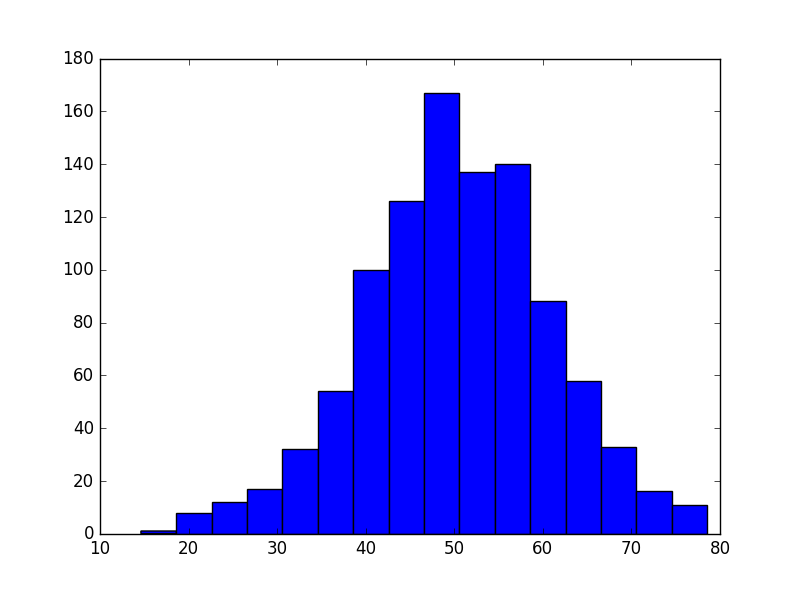
棒の数を 16 に指定
plt.hist(x, bins=16)
下限、上限を設定
plt.hist(x, range=(50, 100))

正規化 (合計すると 1 になるよう調整)
plt.hist(x, normed=True)

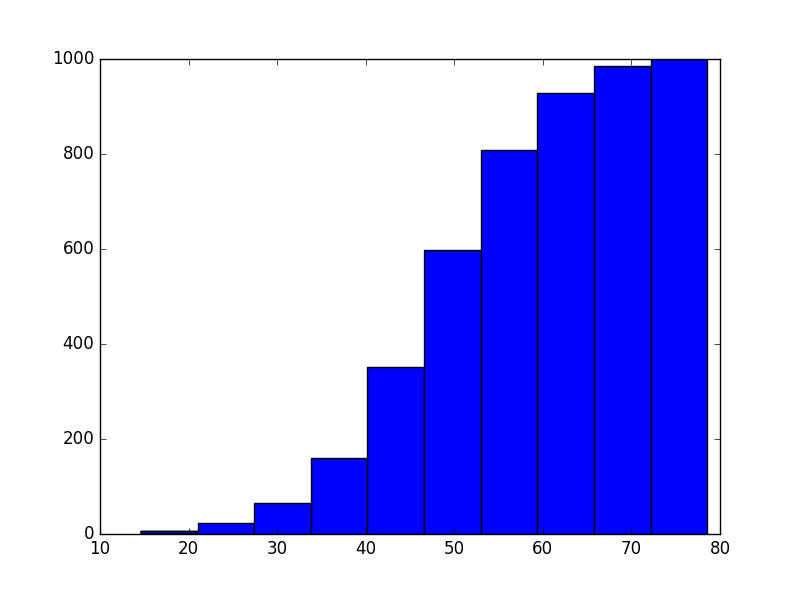
累積値を出力
plt.hist(x, cumulative=True)
ヒストグラム下側の余白を 30 に設定
plt.hist(x, bottom=30)

縦軸を対数目盛で表示
plt.hist(x, log=True)

棒の幅を 0.8 に設定
plt.hist(x, rwidth=0.8)

棒の色を設定
plt.hist(x, color="red")

塗りつぶしなしの線で出力
plt.hist(x, histtype="step")

塗りつぶしありの線で出力
plt.hist(x, histtype="stepfilled")

棒の位置・方向に関する設定
各棒の位置を目盛上の左側に設定
plt.hist(x, align="left")

各棒の位置を目盛上の右側に出力
plt.hist(x, align="right")

棒の向きを横方向に出力
plt.hist(x, orientation="horizontal")

積み上げヒストグラム
積み上げヒストグラム (histtype オプションで指定)
# 平均 20, 標準偏差 10 の正規乱数を1,000件生成
y = np.random.normal(10, 10, 1000)
plt.hist([x, y], histtype="barstacked")
積み上げヒストグラムとして出力 (stacked オプションで指定)
plt.hist([x, y], stacked=True)
積み上げヒストグラムの色を指定する
plt.hist([x, y], stacked=True, color=['#f46d43', '#66bd63'])

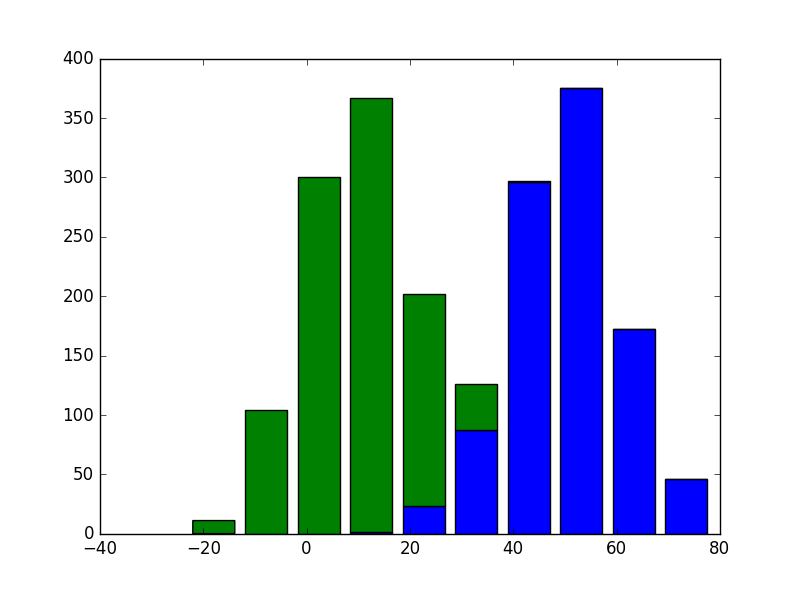
積み上げ棒グラフとして出力しない(複数の棒を並べて描画)
plt.hist([x, y], stacked=False)

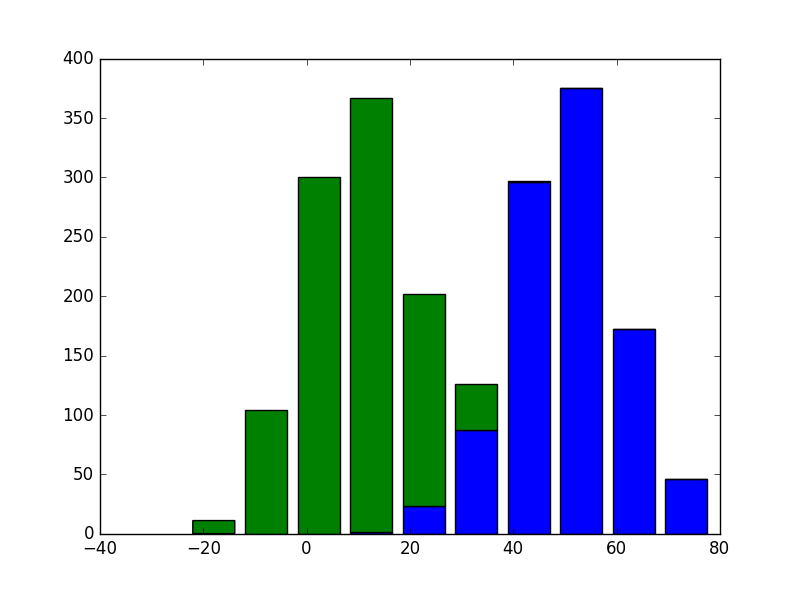
凡例を表示
labels = ['V1', 'V2']
plt.hist([x, y], label=labels)
plt.legend()
