本ページでは、Python のグラフ作成パッケージ Matplotlib を用いて棒グラフ (Bar chart) を描く方法について紹介します。
matplotlib.pyplot.bar の概要
matplotlib には、棒グラフを描画するメソッドとして、matplotlib.pyplot.bar が用意されてます。
matplotlib.pyplot.bar の使い方
matplotlib.pyplot.bar(left, height, width=0.8, bottom=None, hold=None,
                      data=None, **kwargs)
matplotlib.pyplot.bar の主要な引数
| left (必須) | 各棒の X 軸上の数値 |
|---|---|
| height (必須) | 各棒の高さ |
| width | 棒の太さ (デフォルト値: 0.8) |
| bottom | 各棒の下側の余白。(主に積み上げ棒グラフを出力するために使います) |
| color | 棒の色。 |
| edgecolor | 棒の枠線の色 |
| linewidth | 棒の枠線の太さ。 |
| tick_label | X 軸のラベル |
| xerr | X 軸方向のエラーバー (誤差範囲) を出力する場合、数値または配列を指定。 |
| yerr | Y 軸方向のエラーバー (誤差範囲) を出力する場合、数値または配列を指定。 |
| ecolor | エラーバーの色を値または配列で指定。 |
| capsize | エラーバーの傘のサイズを指定。 |
| align | 棒の位置。’edge’ (垂直方向の場合:左端, 水平方向の場合:下端) または ‘center’ (中央)を指定。 (デフォルト値: ‘edge’ ) |
| log | True に設定すると、対数目盛で出力します。 (デフォルト値: False) |
基本的な棒グラフの出力例
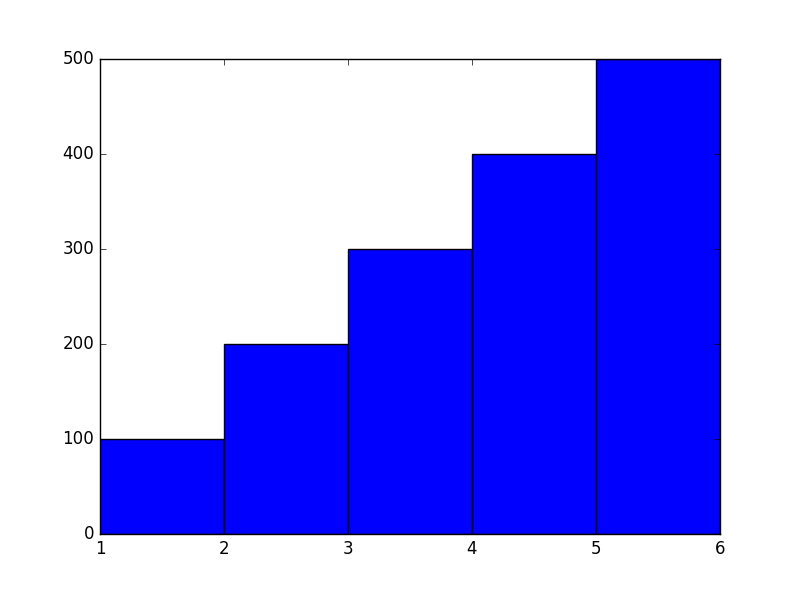
5 本の棒を出力
import numpy as np
import matplotlib.pyplot as plt

left = np.array([1, 2, 3, 4, 5])
height = np.array([100, 200, 300, 400, 500])
plt.bar(left, height)

幅=1.0に設定 (=棒と棒の隙間を表示しない)
plt.bar(left, height, width=1.0)
棒の色を緑色 (#1E7F00) に設定し、枠線を非表示
plt.bar(left, height, color="#1E7F00", linewidth=0)

棒の色、枠線の色、太さを設定
plt.bar(left, height, color="#FF5B70", edgecolor="#CC4959", linewidth=4)

棒の位置を中央に設定
plt.bar(left, height, align="center")

横軸に文字列のラベルを指定
label = ["Apple", "Banana", "Orange", "Grape", "Strawberry"]
plt.bar(left, height, tick_label=label, align="center")

タイトル、X 軸、Y 軸のラベルを出力
plt.bar(left, height, tick_label=label, align="center")
plt.title("This is a title")
plt.xlabel("x axis")
plt.ylabel("y axis")
plt.grid(True)

エラーバー (誤差範囲) を表示する
X 軸方向のエラーバーを一律 0.5 で赤色 (red) で表示
plt.bar(left, height, xerr=0.5, ecolor="red")

Y 軸方向のエラーバーを黒色 (black) で表示
yerr = np.array([10, 20, 30, 40, 50])
plt.bar(left, height, yerr=yerr, ecolor="black")

Y 軸方向のエラーバーを傘のサイズ 10 で表示
plt.bar(left, height, yerr=25, ecolor="black", capsize=10)

Y 軸を対数目盛で表示
plt.bar(left, [200, 2000, 20000, 200000, 2000000], log=True)

積み上げ棒グラフ
積み上げ棒グラフ
bottom パラメータを使用し、下側の余白付きでプロットすることで積み上げ棒グラフを作成しています。
height1 = np.array([100, 200, 300, 400, 500])
height2 = np.array([1000, 800, 600, 400, 200])
plt.bar(left, height1, color="green")
plt.bar(left, height2, bottom=height1, color="orange")

積み上げ棒グラフ (凡例を表示)
height1 = np.array([100, 200, 300, 400, 500])
height2 = np.array([1000, 800, 600, 400, 200])
p1 = plt.bar(left, height1, color="green")
p2 = plt.bar(left, height2, bottom=height1, color="orange")
plt.legend((p1[0], p2[0]), ("Class 1", "Class 2"))
