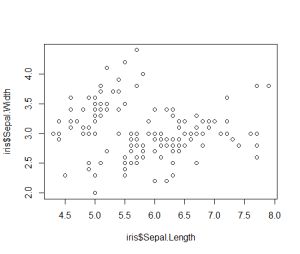
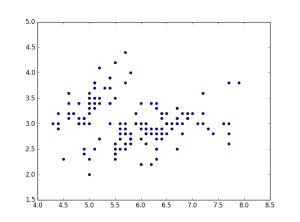
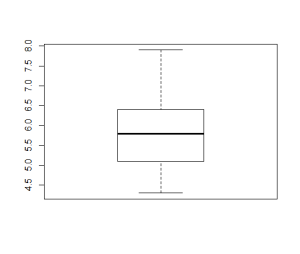
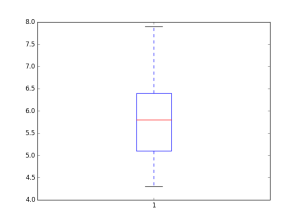
このページでは、前編に引き続き、Ajay Ohri 氏のスライド、”Python for R Users” から、Python と R の違いについて、データ可視化とグラフの作成方法の差異を紹介します。
散布図
箱ひげ図
| R | Python | ||||
|---|---|---|---|---|---|
|
|
||||
|
|
ヒストグラム
| R | Python | ||||
|---|---|---|---|---|---|
|
| ||||
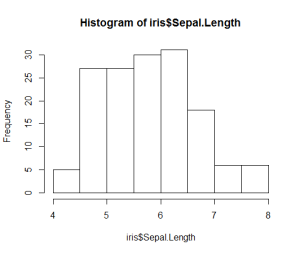
|
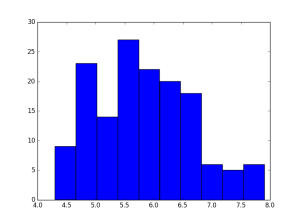
|
折れ線グラフ
| R | Python | ||||
|---|---|---|---|---|---|
|
| ||||
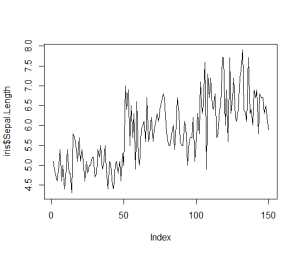
|
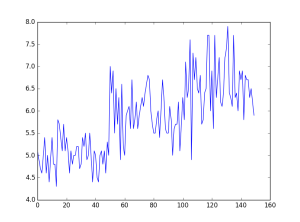
|
円グラフ
| R | Python | ||||
|---|---|---|---|---|---|
|
| ||||
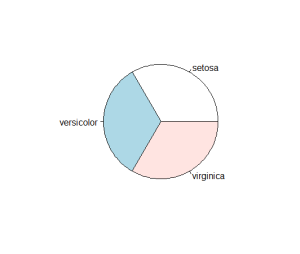
|
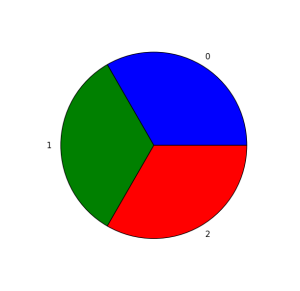
|
棒グラフ
| R | Python | ||||
|---|---|---|---|---|---|
|
| ||||
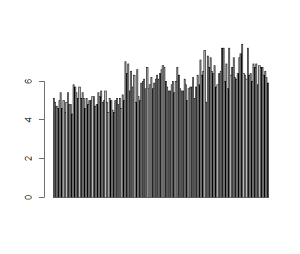
|
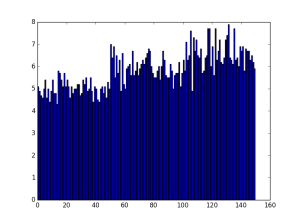
|
