このページでは、前編に引き続き、Ajay Ohri 氏のスライド、”Python for R Users” から、Python と R の違いについて、データ可視化とグラフの作成方法の差異を紹介します。
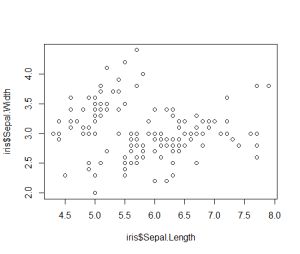
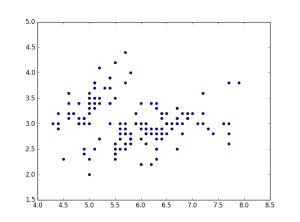
散布図
| R |
Python |
plot(iris$Sepal.Length, iris$Sepal.Width)
|
# Iris データをロード
from sklearn import datasets
iris = datasets.load_iris().data

import matplotlib.pyplot as plt
plt.scatter(iris[:,1], iris[:,2])
plt.show()
|
|
 |
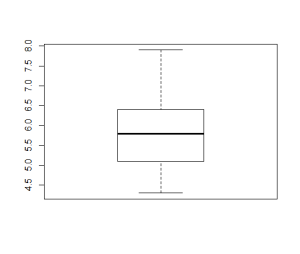
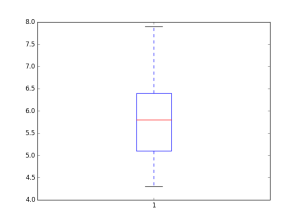
箱ひげ図
| R |
Python |
boxplot(iris$Sepal.Length)
|
# 箱ひげ図
plt.boxplot(iris[:,0])
plt.show()
|
|
|
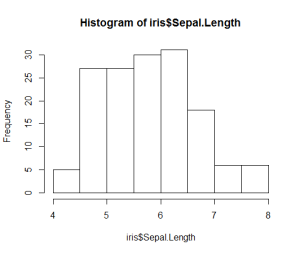
ヒストグラム
| R |
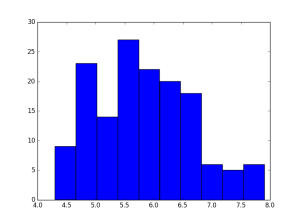
Python |
hist(iris$Sepal.Length)
|
plt.hist(iris[:,0])
plt.show()
|
|
|
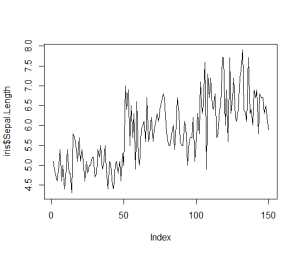
折れ線グラフ
| R |
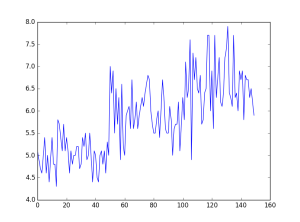
Python |
plot(iris$Sepal.Length, type="l")
|
plt.plot(iris[:,0])
plt.show()
|
|
|
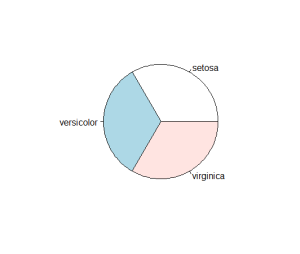
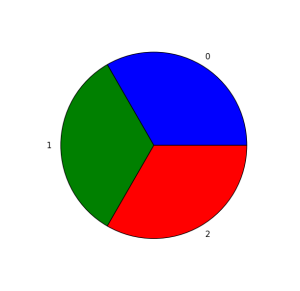
円グラフ
| R |
Python |
pie(table(iris$Species))
|
import pandas as pd
iris = datasets.load_iris().target
crosstab = pd.crosstab(iris, columns="Target")
dict = crosstab['Target'].to_dict()
values = list(dict.values())
labels = list(dict.keys())
plt.pie(values, labels = labels)
plt.show()
|
|
|
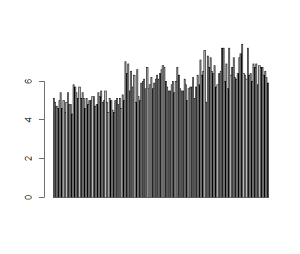
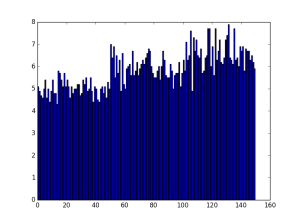
棒グラフ
| R |
Python |
barplot(iris$Sepal.Length)
|
import numpy as np
ind = np.arange(len(iris[:,1]))
plt.bar(ind,iris[:,0])
plt.show()
|
|
|


