Python の ノートブック形式の開発環境 Jupyter Notebook を用いて matplotlib や Seaborn のグラフを出力するには、先頭に、%matplotlib inline という行を記載する必要があります。
Jupyter Notebook でグラフが表示できない場合、正しく記載されているかを確認してみましょう。
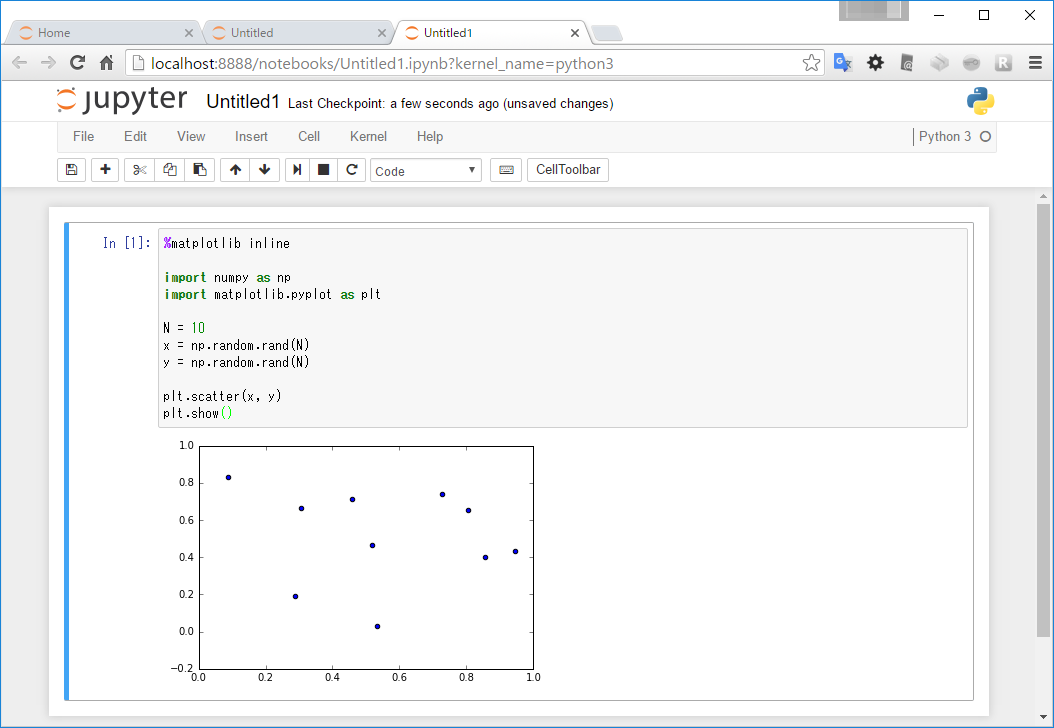
例: Jupyter Notebook で散布図を描画
|
1 2 3 4 5 6 7 8 9 10 11 12 |
%matplotlib inline import numpy as np import matplotlib.pyplot as plt # 乱数を生成 x = np.random.rand(100) y = np.random.rand(100) # 散布図を描画 plt.scatter(x, y) plt.show() |